





 Back to list


Planning is an essential step in the organization and success of Projects. This is true in all fields, but particularly in IT, a sector in which Projects are numerous and often large-scale. The schedule or Gantt chart is a time-honored tool that has naturally become an essential part of any project manager’s toolbox, especially those in the IT sector. What is it used for? What are its advantages? And how do you make the most of it? Here are some answers.
What is a Gantt chart?
The Gantt schedule is a project planning tool that visualizes the various tasks to be accomplished, along with their duration and chronological order. For over a century, named after its American creator, it has been the standard for organizing and managing Projects, and is still considered a benchmark in the field.
It’s called a schedule, but also a Gantt chart, because this planning involves a simplified visual representation: tasks are represented by horizontal bars, and the duration of each task is represented by the length of the bar.
Each bar displays :
- the date by which the task must be completed
- its percentage of completion
- tasks that can be performed in parallel or simultaneously
- the dependencies and interdependencies between different tasks, some of which can only be started once others have been completed.
Classically, a Gantt chart is made up of 4 types of objects
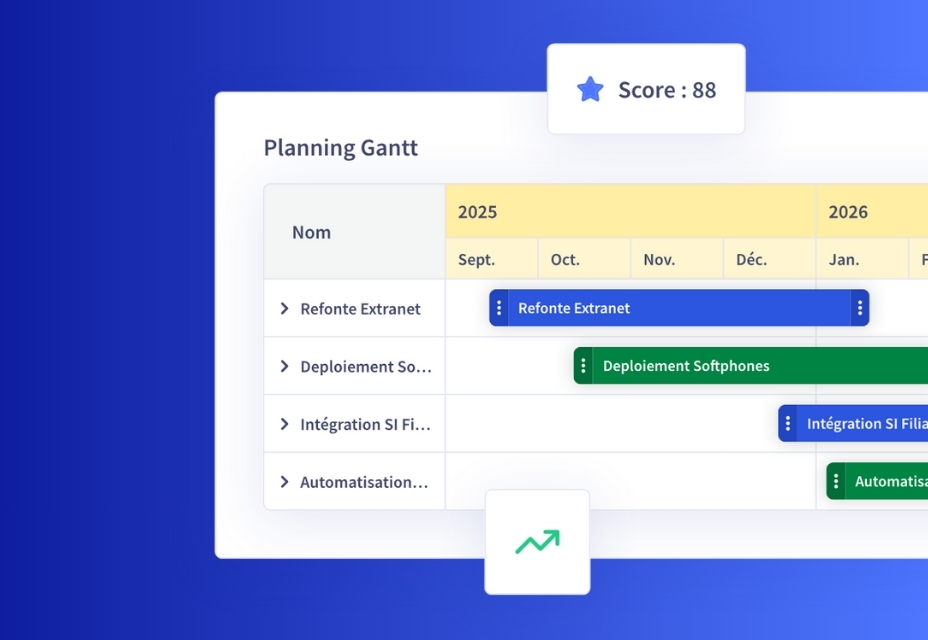
- Phases: these represent the major stages in Projects (Design, Realization, etc.).
- Activities: these designate tasks or actions to be carried out by actors (e.g. “Drafting general specifications”) within each major phase.
- Milestones: these correspond to a key date in the project (e.g.: a deliverable, a validation instance, etc.). Milestones can be called “Commissioning” to mark important milestones in the project.
- Lots: these are useful for breaking down and representing complex Projects (and are themselves made up of phases, activities and milestones).
What is a Gantt chart and who uses it?
The reason why Gantt planning is so common in IT departments is that it is useful for many different types of player, meeting a variety of needs at different stages in the life of a Project.
1 | Initialization: Gantt charts for project managers
Logically, this is the starting point. The Gantt schedule is first and foremost a useful organizational tool for project managers. Well in advance of the launch of a new Project, it will enable him to define the key stages and their duration, and to assign responsibilities to each task.
Let’s not forget that the very definition of a project – which differentiates it from a recurring activity – is to be a time-bound process, with a beginning, an end, and a delivery date. So a project, whatever the method used to manage it (V-cycle or Agility), can be summarily divided into 3 main parts:
| V-cycle | Agility | |
| 1. Design | Framework, functional specifications | Framing, Prototype |
| 2. Realization, development | Identification of sub-phases with deliverables: technical design, development, unit acceptance, functional acceptance, etc. | Sprints |
| 3. Deployment | Deployment, with a commissioning/delivery milestone | |
In concrete terms, with the help of a Gantt chart, the project manager can break down each phase of the project, estimate the number of days needed to complete each one, and from there, work out the overall duration of the project.
Retroactively, this elaboration will enable him toestablish a retroplanning: from a desired delivery date, he can deduce the start-up date needed to meet the expected deadlines and mobilize the Teams accordingly, in coherence with the other Projects in the portfolio.
2 | Project Tracking: the Gantt chart for project team leadership and successful operational management
Once the project has been launched, the Gantt chart will give each player involved an overview of the project and a clear, concise view of its various stages.
Its visual representation makes it easy for each team member to understand his or her role in the Projects, the implications of each action, who is responsible for which tasks, and what deadlines need to be met. It’s a tool that encourages collaboration and coordination.
The Gantt also enables you to track project progress. In this respect, it is particularly well suited to Projects, as it is highly flexible and can be adjusted in real time. IT projects are frequently subject to changes (delays, unforeseen events, problems…) and the schedule must be constantly adapted accordingly to ensure its viability. The Gantt schedule allows you to measure these changes and adjust the schedule in real time to assess the overall progress of the project and the amount of work remaining (tasks or activities 100% completed or still to be done).
And this is true whatever the method chosen for Project management. In Agility, the progress of each sprint will certainly be tracked in detail and managed on a daily basis using specialized tools, but in all cases, the “high-level” view of the schedule as a whole remains essential for steering the project, and can be easily fitted into a Gantt chart (with its start, end, progress and Go-live milestones).
Finally, interdependency management helps to highlight task conflicts: for example, if one job is delayed, it is impossible to complete another at the scheduled time.
It’s a real guide to the success of Projects in the CIO, and is frequently used, along with other visual representations such as weather forecasts, in periodic project reviews.
3 | Project portfolio orchestration: the macro Gantt chart for the PMO, manager or CIO.
In an Information Systems Department, not all projects are equal, whether in terms of their value to the company, the scale of mobilization required, or the time it takes to complete them. On the other hand, they all involve – to a greater or lesser extent – CIO Teams and Resources.
So, while the complexity of Projects varies, so does the level of granularity required to manage them. Nevertheless, it is important for the smooth running of an IT department to have a macro view of the Projects portfolio at all times, which will not only enable it to be steered, but also, at a glance, to read and analyze the CIO’s Roadmap.
The Gantt representation is therefore particularly interesting, as it enables all Projects to be coordinated on the same plan, whatever their level of ambition. For the PMO or IT Manager, it’s a very useful tool: without having to go into the details of all the projects (which may not even be filled in), it gives an overall view of all the projects addressed by the IT department.
It therefore plays a key role in steering committees, where it reviews the progress of the portfolio, measures any discrepancies between the forecast plan and the actual situation, arbitrates where necessary, and gives concrete expression to the consequences of these arbitrations.
4 | Reporting and communication: the portfolio Gantt for the CIO and his business/management contacts
Like all corporate departments, a CIO must be “accountable” for its activities, and in all cases demonstrate the impact of its actions. The Gantt chart – once again applied to the macro vision of the “Project portfolio Gantt” – feeds this high-level vision of the CIO; it helps to make sense, firstly for the team, but also for the Business Units and the CIO, especially as this graphic representation favors accessibility and good understanding by everyone in the organization, even if you’re not an expert in project management.
The Gantt representation of the Projects portfolio can help get many messages across:
- Show the “ tree that hides the forest “: behind the big flagship projects that everyone has in mind, there are often a multitude of smaller, lesser-valued projects that are no less relevant.
- Demonstrate team activity and efficiency
- Reassure people – if need be – that Agility Projects are also part of a “finite” timeframe.
- Share with each Business Division the Projects addressed for itself and for others
What use is a Gantt chart in the CIO?
The Gantt chart has become so popular in CIOs, because it brings numerous benefits to the management and steering of Build activities, for everyone involved. In particular, it enables you to :
- Reconciledifferent management and steering needswithin a common framework, with an adjustable work scale; the same tool can thus be used by all CIO players: Project Manager, PMO, Manager, IT department steering, each at their own level of responsibility. Thanks to its graphical accessibility, which makes it highly intuitive, it also facilitates collaboration with other stakeholders who intervene on a more ad hoc basis and without being experts on the Projects: employees of the company’s other Business Departments, General Management, etc.
- Harmonize practices and deploy a unified work tool: Coming from different backgrounds, the project managers in an IT department don’t necessarily all use the same work tools. Gantt representation – when unified through a common generation tool – has the merit and advantage of enabling everyone to capitalize on a single, standardized model. By sharing the same repository for 100% of projects, in all cases, we can homogenize the management of heterogeneous projects – large or small – a fortiori in a collaborative working environment; it’s a way of working as one, and bringing coherence to the actions of the whole department.
- Reconciling global portfolio management with a variety of project management methodologies : this situation is becoming increasingly common in CIOs, with some project teams working in agile mode, while others stick to the more “classic” V-cycle approach. Although Gantt planning is not well-suited to these agile project management methods, it is nevertheless relevant and recommended to integrate agile projects into the overall portfolio vision. To do this, we can simply set a project start date, an end date (which may be the target for delivery of a 1st functional version), commissioning milestones, probably two initial prototype and pilot phases, and subsequent phases can be materialized by the number of sprints.
- Increase efficiency by making it easier to consolidate the “Project portfolio Gantt” and avoid the pitfalls of re-entering data. This is the whole point of a Gantt chart that summarizes the entire portfolio in a simplified macro-planning view, self-generated from all the Projects Gantt charts: you can then go back and forth from macro to micro, and vice versa, from top>down to bottom>up, without asking the players at the interface of the two needs (often the project manager) to update the detailed planning and the macro-planning twice, an activity which naturally arouses a certain amount of resistance.
- Become a real support for analysis and steering, and speed up decision-making. Projects rarely go according to plan. While the Gantt schedule is a living tool that lets everyone know where they really stand at any given moment, it is also very useful to use it to reveal and measure discrepancies, by comparing the actual view with previous forecast situations. In this way, for example, you can capitalize on feedback to revise abacuses following an incorrect time evaluation.
On the portfolio management side, updating the Gantt chart makes it easy to reconfigure the roadmap to make the most of available Resources. Having a Gantt chart of the Projects portfolio speeds up decision-making. Provided that it is accurate, and that the data on which the CIO or PMO bases decisions is actually up to date with the progress of each project.
The keys to a successful Gantt chart
- Working with a single Gantt for the whole CIO: each project manager and his or her Teams have a detailed view for operational management, while senior management has access to a synthetic view, generally sufficient for the level of steering required. On the other hand, the uniqueness of the Gantt guarantees seamless data consistency.
- Simple projects are more efficient if they’re simply mapped out. As we’ve already seen, not all Projects are equal, and not all of them require “over-investment” in their planning. To gain an overall view, we can therefore, in the absence of complexity, adopt a classic division into 3 phases (design, development, deployment) and assign them standard units of time. This may be enough to give an idea of the broad outlines of Projects planning, without the need to go into greater detail. Some software packages on the market, such as Abraxio, offer this functionality in a generic or customized way.
- Automate the impact of schedule shifts. Gantt charts must be living, dynamic tools that adjust to project reality. They therefore need to be updated frequently, as often as possible in real time. While Gantt charts can be produced using office software (such as Excel or Powerpoint), you can avoid tedious and time-consuming updates by using dedicated planning software, which automates and automatically recalculates, for example, the impact of delays on dependent tasks.
Which Gantt chart tool is right for the CIO?
As Gantt planning is commonplace, the market offers numerous solutions of varying degrees of sophistication to exploit this type of formalization. The choice of tool should be guided by the – often heterogeneous – needs of CIO players:
- Office tools such as Excel or Powerpoint: accessible to all at no extra cost, their most common limitations are that they are not collaborative and are very difficult to update and consolidate.
- Dedicated project management tools: some major players on the market offer project management solutions with highly sophisticated Gantt charts; while they have the merit of being very complete for the PMO or expert project manager, they may be more difficult to access for employees with a less in-depth project culture. As a result, once the good intentions of the start-up phase have passed, the software is used less and less frequently, and the chosen solution falls into disuse, despite the often substantial subscription costs. The result is a two-tier Project management system, with the “experts” and the others, which is also detrimental to the dynamics of the Information Systems Department.
- Portfolio management tools : generally designed with reporting in mind, they lack the operational side of project management. This makes them too simplistic for the Project Manager, who is obliged to enter his data in 2 separate solutions. For the CIO, the solution is equally imperfect, as it doesn’t allow him to go down into the depths of a Project if he needs or is asked for details.
- IT department steering toolslike Abraxio. They reconcile the project and project portfolio management needs of the entire CIO in a single software package, with working views adapted to the needs of each player. With a level of complexity adapted to real needs, and no “over-functionalities”, they cover the essential requirements of planning with efficiency, performance, ease of use and appropriation.